100-Year Child Financial Plan - Feasibility
Generated by backend/childplan from the project's own data and the World Bank CPI series retrieved 2026-10-24. Monte Carlo: 10,000 paths, seed 20261024, stationary block bootstrap (mean block 3 years). A simulation is not a prediction. This is an analysis of an illustration, not personal financial advice.
1. Executive summary
Verdict: not reliable as written. With the corrected ages the early stages come close to the stated figures if the return is a steady 12%, but the plan needs that 12% every year for 99 years; under Indian historical return sequences only about 20%-37% of simulated paths pay every cost and reach age 100.
Plan as analysed (after the corrections you gave): child aged 1 at the first investment of ₹15 lakh; yearly SWP from age 6 to 20, ₹1 lakh in the first year rising 5% a year; education ₹4+4+4+6 lakh at 17-20; marriage ₹50 lakh at 25; retirement ₹84 lakh a year (rising 5%) from 50 to 100. The brief as first written (child aged 11, SWP 20 years from 17) is kept only for comparison.
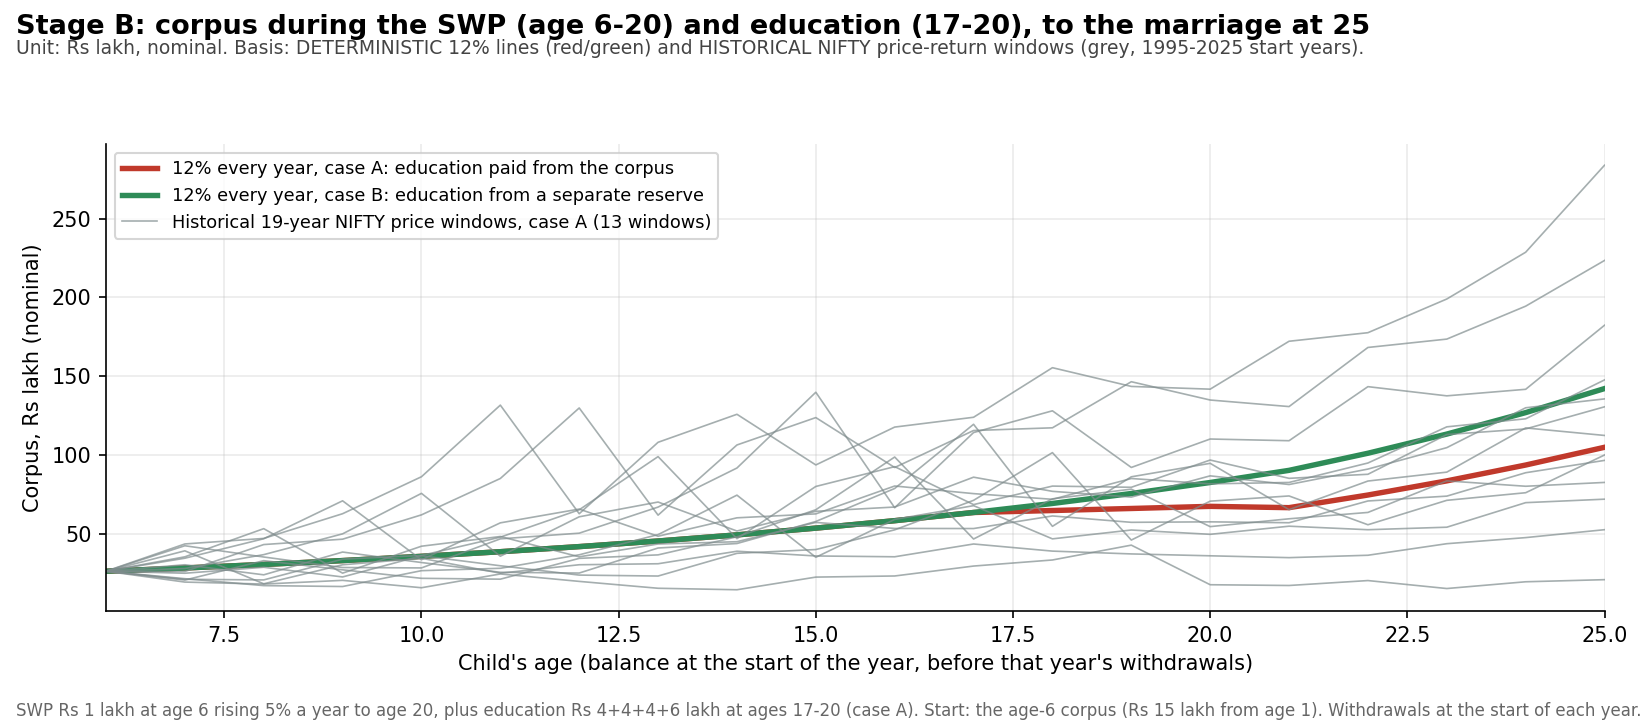
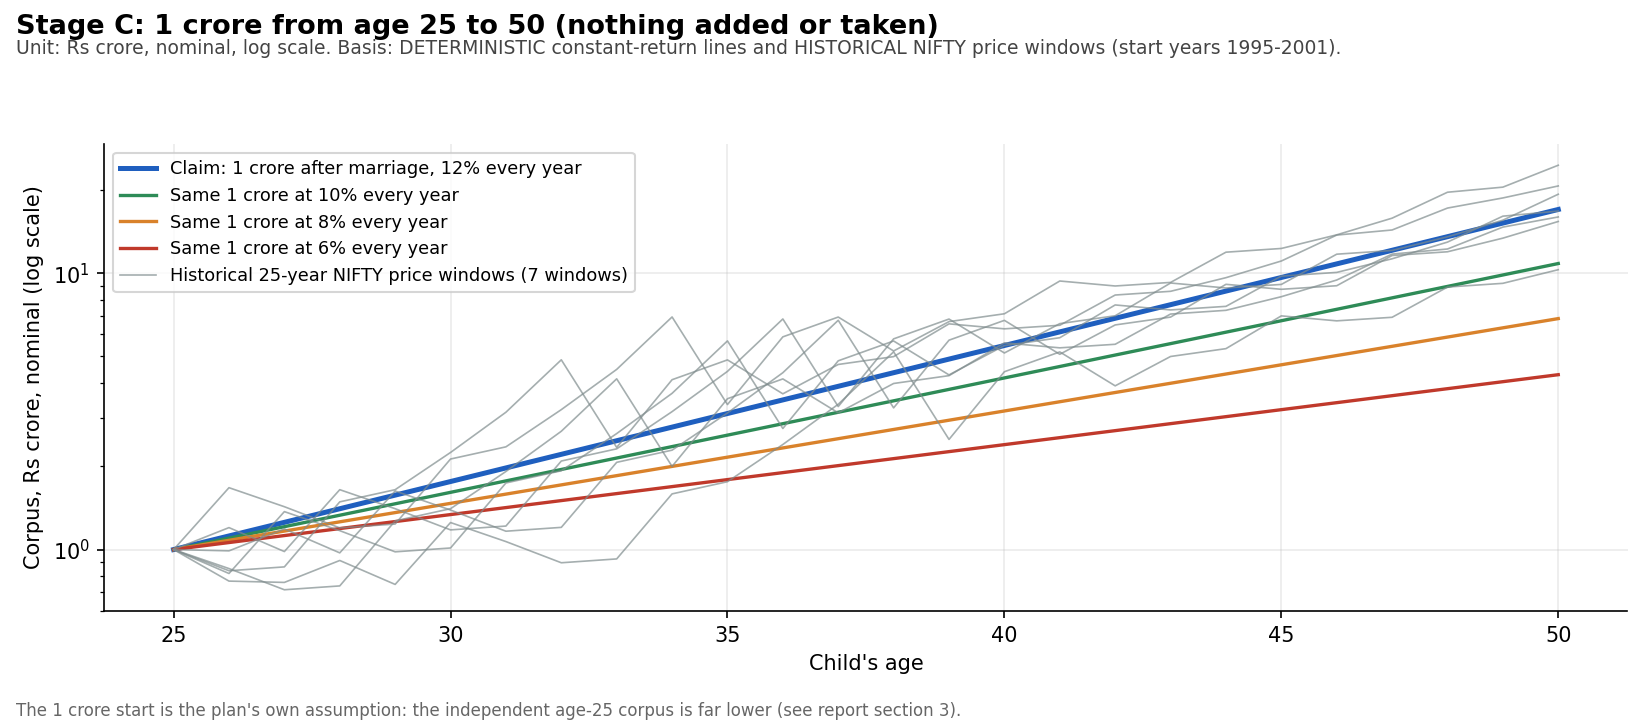
- Early stages (age 1 to 25) at a steady 12%. ₹15 lakh grows to ₹26.4 lakh by age 6; the SWP (15 withdrawals, ₹21.6 lakh in all) and the ₹18 lakh of education leave ₹105.0 lakh at 25 if both are paid from the corpus (case A; ₹118.1 lakh with end-of-year timing) and ₹142.2 lakh if education has its own reserve (case B; ₹151.4 lakh at year end, plus a reserve of ₹4.3 lakh at age 6). The claimed ₹1.50 crore is reproduced only in case B with end-of-year timing (101% of the claim); case A reaches 70%-79%. After the ₹50 lakh marriage the corpus is ₹55.0 lakh-₹101.4 lakh against the claimed ₹1 crore, and at 12% it becomes ₹9.3 crore (case A) to ₹17.2 crore (case B) at age 50, against ₹17 crore. The ₹1 crore to ₹17 crore step is plain arithmetic and holds.
- Retirement arithmetic. ₹17 crore at 12% with ₹84 lakh a year rising 5% ends between ₹1,183.0 crore (withdrawals at the start of each year) and ₹1,582.6 crore (end of year); the ₹1,325 crore claim sits inside that range but matches none of the exact conventions tested (nearest: ₹1,369.9 crore with monthly withdrawals). That is a nominal figure at 12% every year. In today's rupees, at 6% inflation, ₹84 lakh at age 50 buys what ₹4.8 lakh buys today (about ₹40,282 a month, not ₹7 lakh), and the ₹17 crore is worth ₹1.0 crore.
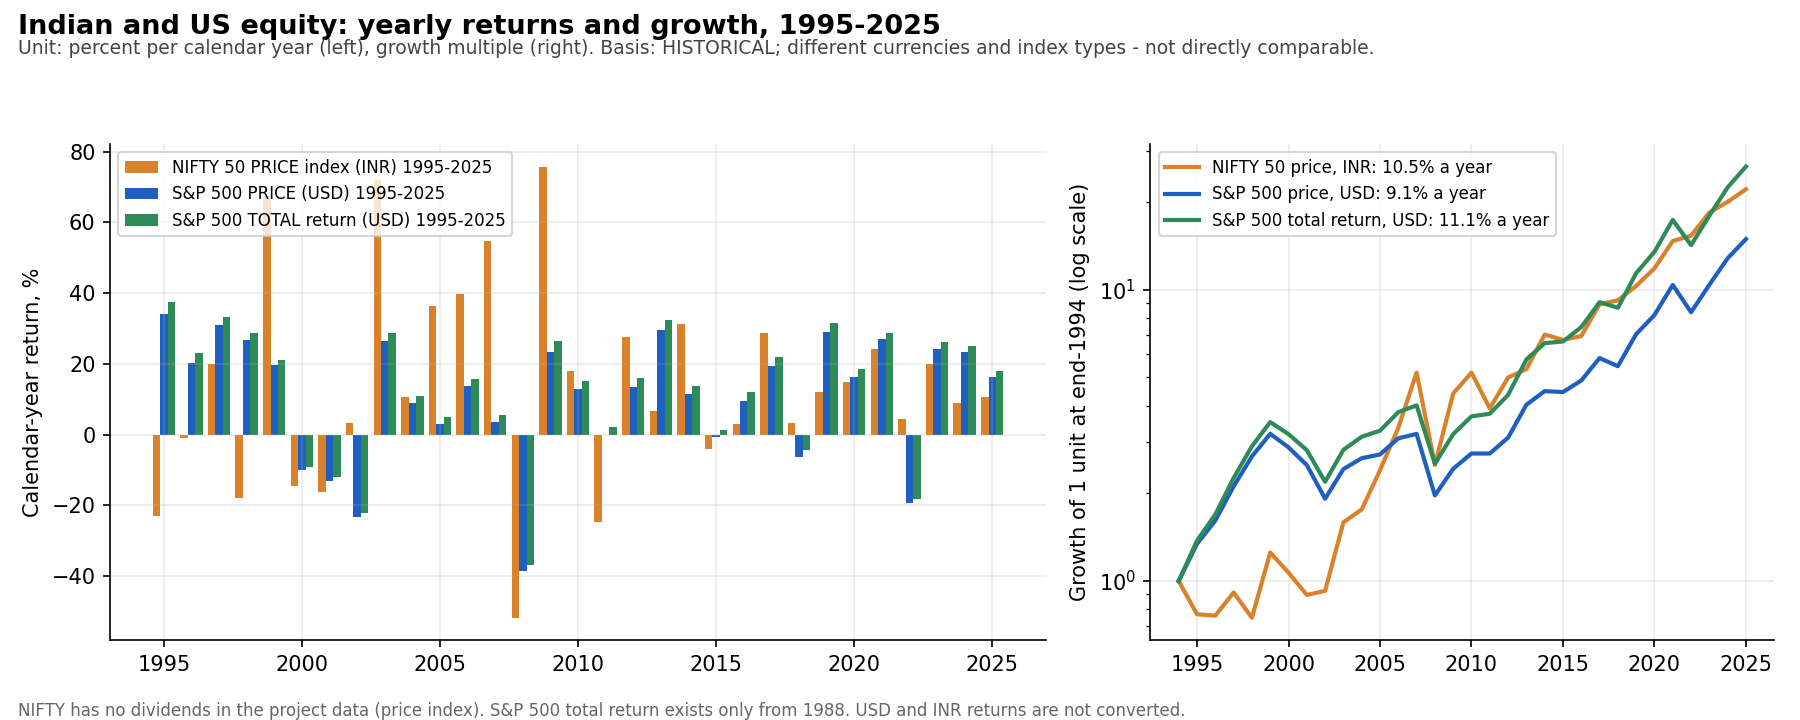
- Historical Indian returns are lower than 12%. NIFTY 50 price returns 1995-2025 compound at 10.5% a year (arithmetic mean 14.2%, volatility 28.8%, worst year -51.8% in 2008); after India's CPI (6.4% a year over the same years) the real return is 3.9%. The price index omits dividends, so the true total return is somewhat higher; no NIFTY total-return history exists in the project.
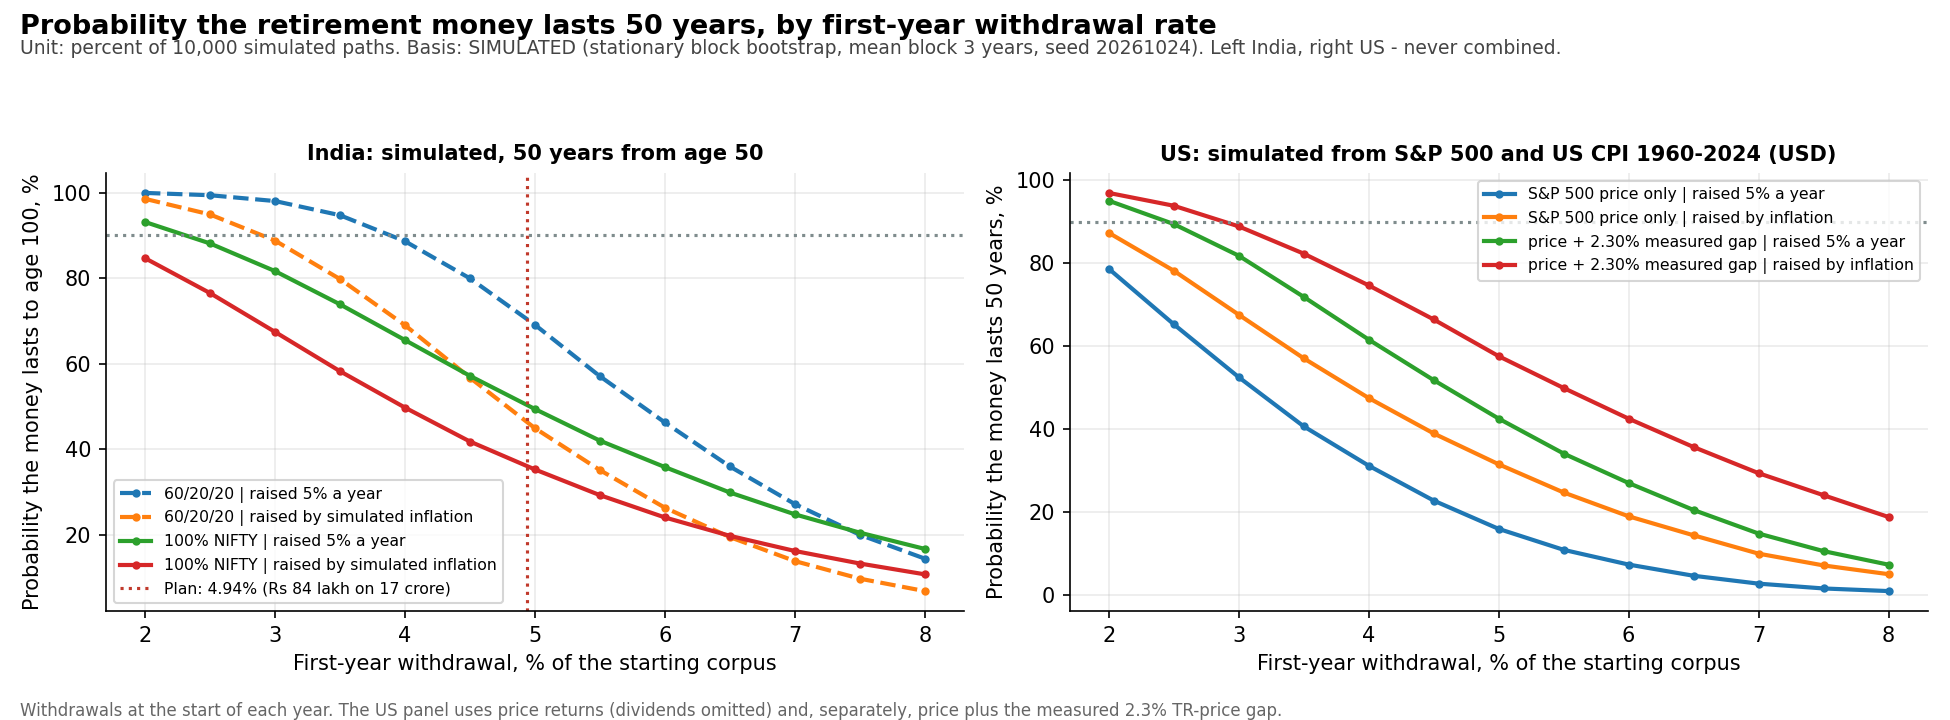
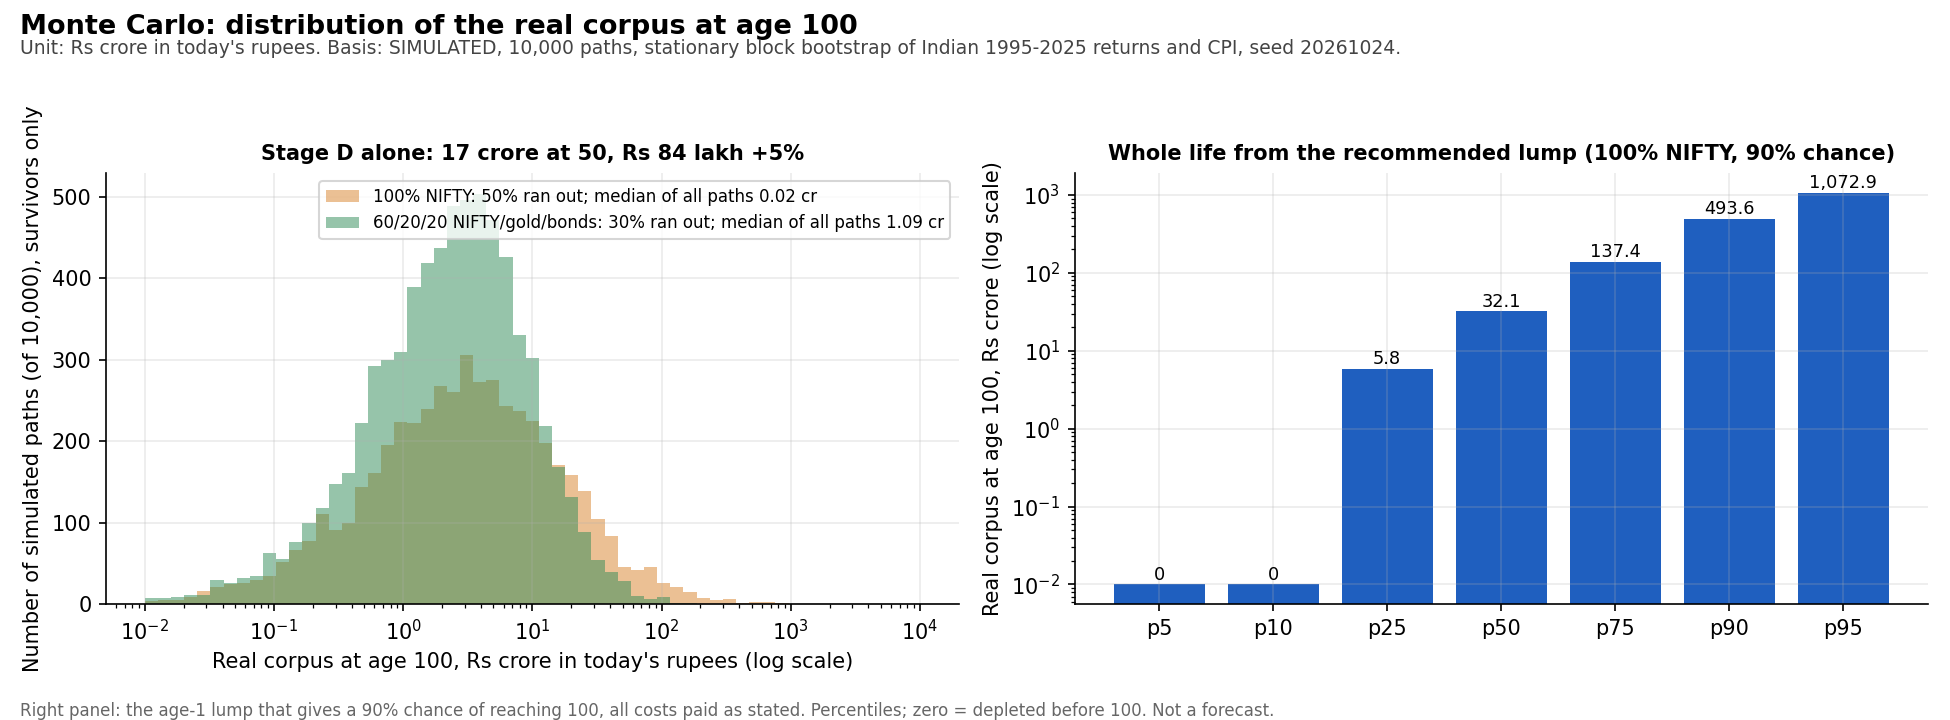
- Retirement from ₹17 crore at age 50 (the plan's own number). With ₹84 lakh rising 5% a year for 50 years, the simulated chance the money lasts to 100 is 50% for 100% NIFTY and 70% for a 60/20/20 NIFTY/gold/bond mix. The first-year withdrawal that gives a 90% chance is only about 2.3% (100% NIFTY) to 3.9% (mixed) of the corpus, against the plan's 4.94%. Using the same withdrawal structure on US history (S&P 500 price returns, 1960-2024 start years), 15 of 16 fifty-year retirements ran out of money.
- Whole life, all costs as stated, from ₹15 lakh at age 1. At a constant 12% the whole chain survives to 100 in case B but runs out at age 68 in case A (the corpus at 50 is too small for ₹84 lakh a year). With Indian historical sequences (simulated) the plan reaches 100 in 20% (case A) to 26% (case B) of 100% NIFTY paths and 26% to 37% of 60/20/20 paths; 49% of 100% NIFTY paths cannot even pay the marriage (case A). A 90% chance needs about ₹108.9 lakh at age 1 for 100% NIFTY or ₹40.5 lakh for the 60/20/20 mix (against ₹15 lakh), or level yearly contributions of about ₹2.3 lakh (mixed) to ₹7.0 lakh (equity) for ages 1-24. The mixed-portfolio advantage rests heavily on gold's very strong 1995-2025 record (including +75% in 2025); treat it as an upper bound.
- Strategy matters as much as size. A withdrawal fixed at a percentage of the current corpus (3-5%) never runs out but its rupee income swings with the market; a fixed ₹84 lakh rising 5% is exposed to sequence risk; one raised with actual inflation fails more often, because Indian inflation averaged more than 5%. Details in sections 9, 11 and 12.
2. Original plan and assumptions
| Stage | Assumptions used | Stated result |
|---|---|---|
| A. Accumulation | ₹15,00,000 invested when the child is 1; 12% a year; grows to age 6, when the SWP starts (5 years) | ≈ ₹26.4 lakh at 6 (the brief's ₹29.61 lakh equals 6 years of growth) |
| B. SWP | Yearly SWP from age 6 to 20 (15 withdrawals): ₹1,00,000 in the first year, +5% a year | ₹21.6 lakh in total |
| B. Education | ₹4 lakh at 17, 18, 19; ₹6 lakh at 20 (total ₹18 lakh): the last four SWP years | unclear if inside the SWP |
| C. Marriage | Corpus ₹1.50 crore at 25, marriage ₹50 lakh, ₹1 crore remains; 12% for 25 years | ≈ ₹17 crore at 50 |
| D. Retirement | ₹7 lakh a month (₹84 lakh a year) from age 50, +5% a year, 50 years to age 100; 12% a year | ≈ ₹1,325 crore at 100 |
Corrections applied. The brief first said the child was 11 at the first investment, with 6 years of growth to 17 and a 20-year SWP from 17 (ages 17-36). You corrected it to: child aged 1, yearly withdrawal from age 6 to 20 with a 5% step-up each year. The first-year amount (₹1 lakh) and the education bills (ages 17-20) are unchanged. Because the plan has no contribution after the first investment, the money simply grows from age 1 to 6, then funds the SWP, the education bills and the marriage.
Conventions used here. Annual model, one step per year. Unless a table says otherwise withdrawals are taken on the first day of the year and the rest then earns that year's return; the alternative (end of year) is shown where it matters. A year's amount rises at the start of the next year. Monthly retirement withdrawals are also modelled monthly (monthly rate (1+r)^(1/12)-1, amount raised every 12th month). Taxes, expense ratios, exit loads, capital-gains tax and transaction costs are not modelled (every number is before them); they would make every result worse.
How the SWP and education dates were read. 'From age 6 to 20' is read as 15 withdrawals at ages 6, 7, ..., 20, each 5% larger than the last. The education bills (ages 17-20) fall in the last four SWP years, so the two overlap. Case A pays both from the one corpus (education on top of the SWP; each bill counted once). Case B pays education from a separate reserve and the corpus pays only the SWP; the reserve needed at age 6 is ₹4.3 lakh at 12% (₹18 lakh nominal). A third reading, education inside the SWP (the larger of the two in a year), is shown in section 3.
3. Independent validation of every stated corpus calculation
All values nominal, constant 12% a year, as the original assumes. 'Reproduced' is computed by childplan.plan; unit tests cover the arithmetic (backend/tests/test_childplan.py).
| Item | Original claim | Reproduced | Verdict |
|---|---|---|---|
| Corpus at 6 (Stage A, 5 years) | - | ₹26.4 lakh | The brief's ₹29.61 lakh is 6 years of growth (₹29.6 lakh): confirmed arithmetic, but 5 years apply after the correction |
| Corpus at 25, case A (SWP + education from corpus), start-of-year | ₹1.50 crore | ₹105.0 lakh (70%) | Not supported |
| Corpus at 25, case A, end-of-year | ₹1.50 crore | ₹118.1 lakh (79%) | Partly supported |
| Corpus at 25, case B (education separate), start-of-year | ₹1.50 crore | ₹142.2 lakh (95%) + ₹4.3 lakh reserve at 6 | Partly supported |
| Corpus at 25, case B, end-of-year | ₹1.50 crore | ₹151.4 lakh (101%) + reserve | Supported |
| Corpus at 25, education inside the SWP, start-of-year | ₹1.50 crore | ₹120.4 lakh (80%) | Partly supported |
| After the ₹50 lakh marriage (case A / case B, start-of-year) | ₹1.00 crore | ₹55.0 lakh / ₹92.2 lakh | Below the claim |
| After the ₹50 lakh marriage (case A / case B, end-of-year) | ₹1.00 crore | ₹68.1 lakh / ₹101.4 lakh | Case B end-of-year matches |
| ₹1 crore for 25 years at 12% | ≈ ₹17 crore | ₹17.0 crore | Arithmetic confirmed (given the ₹1 crore) |
| Age-50 corpus implied by the actual age-25 balances (A start / A end / B start / B end) | ₹17 crore | ₹9.3 crore / ₹11.6 crore / ₹15.7 crore / ₹17.2 crore | Only case B end-of-year reaches ₹17 crore |
| Age-100 corpus, withdrawals at start of year | ≈ ₹1,325 crore | ₹1,183.0 crore | Not reproduced (-10.7%) |
| Age-100 corpus, withdrawals at end of year | ≈ ₹1,325 crore | ₹1,582.6 crore | Not reproduced (+19.4%) |
| Age-100 corpus, monthly withdrawals (₹7 lakh a month, raised yearly) | ≈ ₹1,325 crore | ₹1,369.9 crore | Nearest, +3.4% |
| Age-100 corpus, monthly with r/12 per month (12.68% effective) | ≈ ₹1,325 crore | ₹2,220.4 crore | Different assumption (higher effective return) |
| Age-100 corpus with no withdrawals at all | - | ₹4,913.0 crore | For scale: 17 crore x 1.12^50 |
Total withdrawn over the 50 retirement years is ₹175.9 crore nominal. The ₹1,325 crore figure lies between the start-of-year and end-of-year conventions, so it is plausible for some timing, but it cannot be reproduced from the stated rules alone.
How sensitive is the age-25 corpus to the return? Case A, start of year, Stage A-B both at that constant return: 6%: ₹0.0 lakh, 8%: ₹12.2 lakh, 10%: ₹47.0 lakh, 12%: ₹105.0 lakh. To reach exactly ₹1.50 crore at 25 at 12% (case A, start-of-year) you would add ₹0.6 lakh every year from age 6 to 24, or ₹3.0 lakh extra at age 1 (case B: ₹0.1 lakh a year or ₹0.5 lakh extra). These gaps are small at 12% but the result is extremely sensitive to the return: at 8% the same corpus at 25 is a tenth of the claim, at 6% it is exhausted.
4. Data sources and data-quality assessment
Existing project datasets were inspected and reused read-only (no dataset was modified). The only newly fetched data is the World Bank CPI series.
| dataset | source | period | frequency | limitations |
|---|---|---|---|---|
| India CPI inflation | World Bank WDI FP.CPI.TOTL.ZG (fetched live) | 1960-2025 | annual | Percent change, not an index level. 2026 not yet published. Annual average, not December-to-December. |
| US CPI inflation | World Bank WDI FP.CPI.TOTL.ZG, USA (fetched live) | 1960-2024 | annual | 2025 has no value. Used only for US scenarios. |
| NIFTY 50 | eq_store masid 1 (NSE index closes) | 1991-01-02 to 2026-09-25 | daily | PRICE index: dividends excluded, so returns are understated by roughly the dividend yield. 'Nifty 50 Futures TR Index' in scr_master is a futures index, not a cash total-return index. |
| Gold, India rate (INR/g incl. 3% GST) | MCX Gold spot (scr_mcxsp_eod, GOLD) from 2005-06; GOLDINR (scr_global_price) before | 1994-12 to 2026-09 | daily | Two instruments joined with a matching factor; frozen MCX 2020 prices replaced by an estimate (Asset Allocation module rules). |
| Bond proxy | SBI 1-2yr FD year-end rate (te_price in_fixed_deposit_rate) to 2014; NIFTY Composite G-sec Index from 2015-10 (masid 987121) | 1995-2025 | annual | Spliced proxy of two different instruments; FD years book one fixed rate, G-sec years are market returns; 2015 is a part year. |
| S&P 500 (price) | scr_global_price masid 5 (GlobalArchive CSV + Yahoo Finance) | 1950-01-03 to 2026-09-30 | daily | PRICE only, no dividends. In USD. |
| S&P 500 Total Return | scr_global_price masid 60 (Yahoo Finance) | 1988-01-04 to 2026-10-22 | daily | Only 38 full calendar years. In USD. |
| Dow Jones | scr_global_price masid 4 | 1896-05-26 to 2026-09-30 | daily | Price index; not used in the simulations. |
| Shiller historical stock data | NOT in the project | - | - | No Shiller dataset exists in the project, so no pre-1950 US equity history is used. |
| US Treasury / bond returns | NOT in the project | - | - | Absent, so US diversified scenarios are not run. |
| US CPI index level (FRED/BLS) | NOT in the project | - | - | Only the World Bank annual percent change is used. |
Checks on the price series used (duplicates, gaps, extremes):
| Series | First | Last | Rows | Duplicate dates | Longest gap | Worst day | Best day |
|---|---|---|---|---|---|---|---|
| NIFTY 50 (price) | 1991-01-02 | 2026-09-25 | 8719 | 0 | 19 days (to 1992-07-15) | -12.98% (2020-03-23) | 17.74% (2009-05-18) |
| S&P 500 (price) | 1950-01-03 | 2026-09-30 | 19308 | 0 | 7 days (to 2001-09-17) | -20.47% (1987-10-19) | 11.58% (2008-10-13) |
| S&P 500 Total Return | 1988-01-04 | 2026-10-22 | 9774 | 0 | 7 days (to 2001-09-17) | -11.98% (2020-03-16) | 11.58% (2008-10-13) |
No duplicate dates, no non-positive closes; the extreme days are real events (NIFTY -12.98% on 23 Mar 2020, S&P 500 -20.5% on 19 Oct 1987). The NIFTY history starts on 2 Jan 1991; the study uses 1995 onward as requested (the 1991-94 closes are available but excluded). 2026 is incomplete in every store (data end Sep 2026), so the last full calendar year used is 2025.
NIFTY is a price index. The store holds closes of the NIFTY 50 index only (no dividends). Its returns are therefore price returns, labelled as such throughout. A NIFTY 50 total-return history is not in the project; the only 'TR' index names in scr_master are the Nifty 50 Futures TR index and leveraged/inverse products, which are not a cash total-return series. Nothing was substituted. The US data is the opposite: S&P 500 price (1950-) and S&P 500 total return (1988-) exist side by side, so the dividend gap can be measured (2.30% a year on average over 1989-2025). That measured US gap is used only in US scenarios; it is not applied to NIFTY.
Not available in the project, so not used: Robert Shiller's historical stock dataset, US Treasury or bond returns, a CPI index level. The US inflation series (World Bank, 1960-2024; 2025 not yet published) is used only with US returns.
4.1 World Bank India CPI (fetched)
- Indicator
FP.CPI.TOTL.ZG(Inflation, consumer prices, annual %), World Development Indicators, country IND. Units: annual percent change of the consumer price index (calendar-year average). - Retrieved 2026-10-24T07:09:42+00:00 UTC from
https://api.worldbank.org/v2/country/IND/indicator/FP.CPI.TOTL.ZG?format=json&per_page=200(page: https://data.worldbank.org/indicator/FP.CPI.TOTL.ZG). Raw response saved asdata/worldbank_cpi_IND_raw.json; cleaneddata/india_cpi_inflation.csv/.parquet; metadatadata/worldbank_cpi_metadata.json. - Coverage: 1960 to 2025, 66 observations, no missing years. 2026 is not published, so it is not used. The US series covers 1960-2024 (2025 has no value).
- Fetch note. The exact URL in the brief (with
date=1960:2026) answered HTTP 502 on 2026-10-24, as did any request containingpage=1. The fetcher therefore requests the full series without those parameters and keeps 1960 onward; pagination and HTTP errors are handled with retries. - The series is an annual percent change (calendar-year average), not an index level. Where a level is needed the study builds a chained index from the rates (price level = product of (1+rate)); its base is arbitrary (1.0 = the start of the window) and it is not an official CPI level.
- Cross-checks. (a) The project's own
CPI_India_Annualseries agrees with the fetched data to within 0.05 percentage points for 1996-2025, but both come from the World Bank, so this is a consistency check, not an independent one. (b) Against the Labour Bureau CPI-IW year-on-year series in the project (a different index, industrial workers), the calendar-year averages for 1996-2020 (25 years) correlate at 0.95; the mean difference is -0.20 points and the largest gap is 3.9 points in 2019. (c) A direct cross-check against RBI or MoSPI publications was not done: those sources were not reachable programmatically in this environment, and no figure was copied by hand. - Methodological breaks: India's official headline CPI moved from CPI-IW/AL/RL to CPI-Combined (2012=100) in 2014; the World Bank series is a spliced, internationally harmonised annual series, so the pre- and post-2014 figures are not strictly like for like.
5. Historical Indian inflation analysis
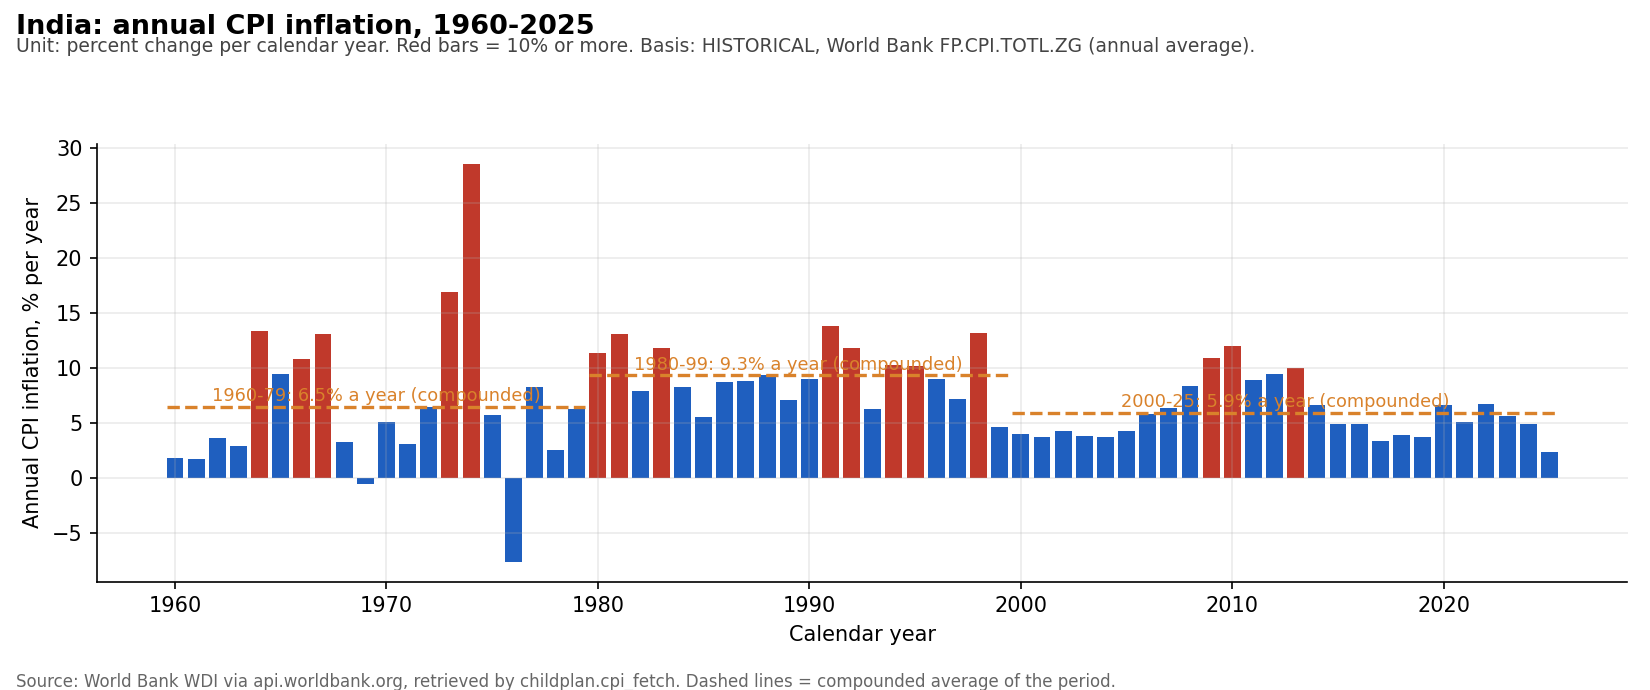
Over 1960-2025, annual CPI inflation averaged 7.2% (median 6.5%); compounded, 7.1% a year. The highest year was 28.6% (1974), the lowest -7.6% (1976); the 10th and 90th percentile years were 3.0% and 12.5%.
| Period | Compounded a year | Simple average |
|---|---|---|
| 1960-1979 | 6.5% | 6.7% |
| 1980-1999 | 9.3% | 9.4% |
| 2000-2025 | 5.9% | 5.9% |
| 1995-2025 (the window used for returns) | 6.4% | 6.4% |
Rolling compounded inflation (annualised, every window ending 1964-2025 that the data supports):
| Window | Windows | Min | 10th pct | 25th pct | Median | 75th pct | 90th pct | Max |
|---|---|---|---|---|---|---|---|---|
| 5 years | 62 | 2.9% | 4.2% | 5.3% | 7.9% | 9.5% | 10.2% | 11.8% |
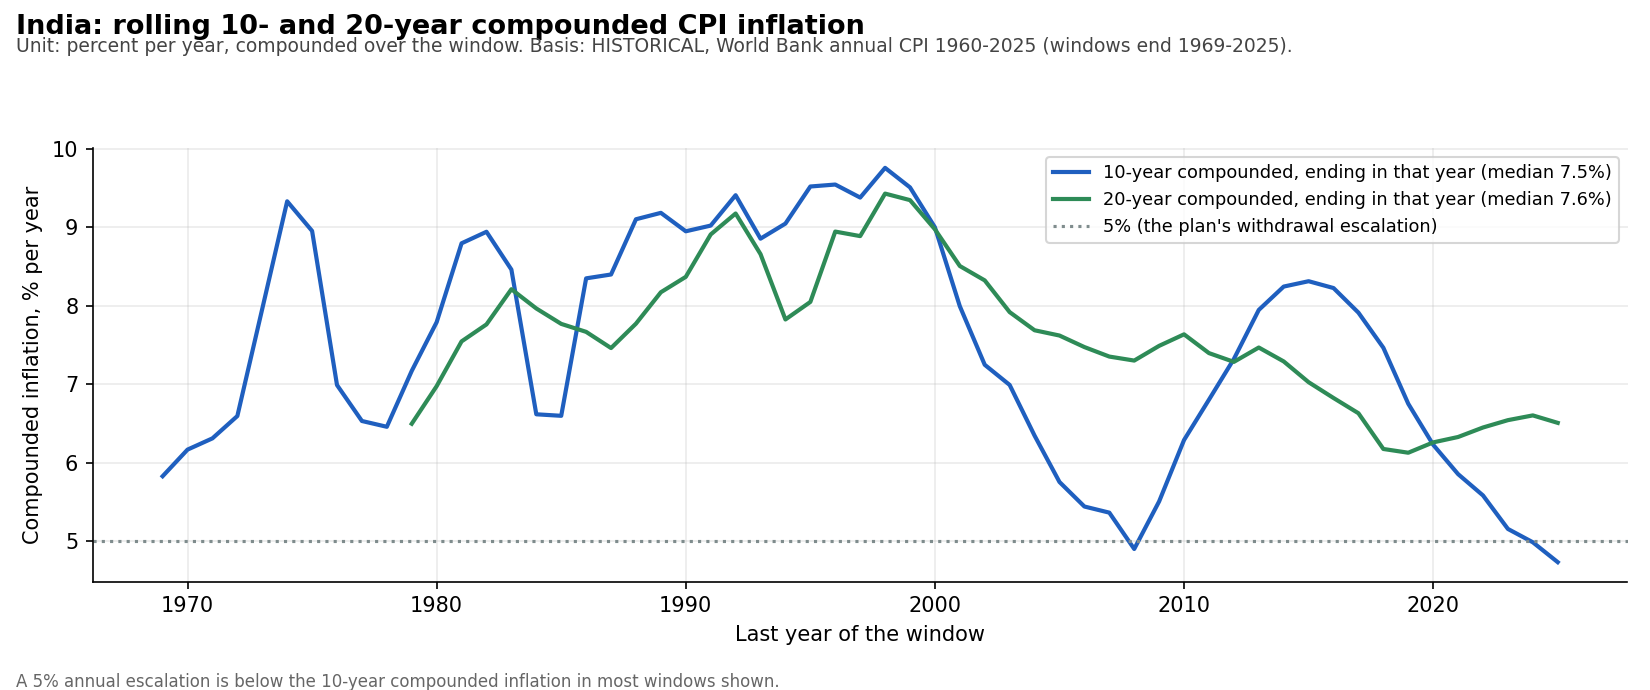
| 10 years | 57 | 4.7% | 5.5% | 6.3% | 7.5% | 8.9% | 9.4% | 9.8% |
| 20 years | 47 | 6.1% | 6.5% | 7.0% | 7.6% | 8.2% | 8.9% | 9.4% |
| 30 years | 37 | 6.3% | 6.8% | 7.4% | 7.9% | 8.3% | 8.5% | 8.6% |
Purchasing power. Prices rose 94-fold between 1960 and 2025 (a 1960 rupee has kept only 1.1 paise of its purchasing power), and 6.8-fold since end-1994. At a constant 6%, a rupee loses 94.6% of its purchasing power in 50 years (₹1 becomes 5.4 paise). A 5% annual increase in withdrawals is below the median 10-, 20- and 30-year compounded inflation in the data, so the plan's income falls in real terms in most windows.
6. Historical Indian and US equity return analysis
| Series | Years | N | Arithmetic mean | Geometric (CAGR) | Std dev | Worst year | Negative years | Real CAGR |
|---|---|---|---|---|---|---|---|---|
| NIFTY 50 price (INR) | 1995-2025 | 31 | 14.2% | 10.5% | 28.8% | -51.8% (2008) | 8 | 3.9% |
| Gold, India rate (INR) | 1995-2025 | 31 | 13.1% | 12.0% | 16.6% | -14.7% (1997) | 6 | 5.3% |
| Bond proxy (FD rate to 2014, G-sec index after) | 1995-2025 | 31 | 7.8% | 7.7% | 3.2% | 0.6% (2015) | 0 | 1.3% |
| S&P 500 price (USD) | 1951-2025 | 75 | 9.4% | 8.1% | 16.6% | -38.5% (2008) | - | 3.5% (1960-2024, US CPI) |
| S&P 500 total return (USD) | 1989-2025 | 37 | 12.8% | 11.3% | 17.4% | -37.0% (2008) | - | - |
Arithmetic vs geometric. The arithmetic mean of NIFTY (price) is 14.2%; the compound growth you actually earn is 10.5%, because volatility (28.8%) drags: a -52% year needs a +108% year to recover. A plan that assumes 12% compounded needs an arithmetic mean well above 12%. Money-weighted returns differ again when money goes in and out (this plan does both); the simulations here track actual cash flows, not CAGR alone.
Common period 1995-2024 (30 years): NIFTY price 10.5%, S&P 500 price 8.9%, S&P 500 total return 10.9% a year (different currencies, not converted). Over 1989-2025 the S&P 500 total return exceeded the price index by 2.30% a year on average (dividends). The S&P 500's own price CAGR over 1951-2025 is 8.1%, below the plan's 12%.
Dependence. NIFTY's year-to-year return autocorrelation (lag 1) is -0.38; with 31 observations it is not statistically meaningful, which is why both an independent-years and a block bootstrap are reported. Annual correlations: NIFTY-gold -0.04, NIFTY-bonds -0.22, NIFTY-inflation -0.16.
Cautions. (1) Pre-1995 US history is not used to fill Indian history; US results are separate scenarios in USD. (2) The bond proxy joins an SBI fixed-deposit rate (1995-2014) to a market index (2015-), so its tiny volatility before 2015 is an artefact of booking a fixed rate. (3) Gold's 1995-2025 record includes +75% in 2025; mixed-portfolio results lean on it.
7. Education and marriage funding feasibility
Deterministic (12%). Paying the SWP and the education from one corpus (case A) leaves ₹66.7 lakh at the end of the SWP (age 21) and ₹105.0 lakh at 25; with a separate education reserve (case B) the corpus is ₹90.4 lakh at 21 and ₹142.2 lakh at 25. A ₹50 lakh marriage at 25 is therefore payable in both cases at a steady 12% and leaves ₹55.0 lakh (case A) or ₹92.2 lakh (case B), with end-of-year timing ₹68.1 lakh and ₹101.4 lakh. The weak point is later: with only ₹55.0 lakh left, case A reaches ₹9.3 crore at 50, not ₹17 crore, and in the whole-life chain the money runs out at age 68; case B lasts to 100.
Historical windows (actual Indian returns and CPI, 8 start years 1995-2002; money at the start of age 25, before the marriage).
| Education | Portfolio | Windows | Median at 25 (nominal) | Worst | Best | Median at 25 (today's ₹) | Reaches ₹1.5 crore | Enough for ₹50 lakh marriage | Corpus ran out before 25 |
|---|---|---|---|---|---|---|---|---|---|
| case A | equity100 | 8 | 106.5 L | 16.0 L | 248.7 L | 24.2 L | 3 of 8 | 7 of 8 | 0 of 8 |
| case B | equity100 | 8 | 144.8 L | 50.1 L | 288.1 L | 32.9 L | 3 of 8 | 8 of 8 | 0 of 8 |
| case A | balanced_60_20_20 | 8 | 117.7 L | 48.5 L | 234.9 L | 26.9 L | 3 of 8 | 7 of 8 | 0 of 8 |
| case B | balanced_60_20_20 | 8 | 153.1 L | 79.0 L | 276.4 L | 35.8 L | 4 of 8 | 8 of 8 | 0 of 8 |
These are only a handful of overlapping windows from one favourable era (the late-1990s to 2000s start years include 1999 and 2003-07, when NIFTY more than doubled several times), so they are an optimistic view of the early stages; the bootstrap in section 11.3, which re-orders the same years, finds that 49% (100% NIFTY) and 34% (60/20/20) of case-A paths run out by age 25, because a bad early sequence (a flat spell or a crash such as 2008) hurts a small corpus that is being drawn down; the 8 windows above are only 8 of the many possible orderings.
Education and marriage costs under inflation. The brief's ₹4+4+4+6 lakh and ₹50 lakh are stated in plain rupees. If they are today's prices (the child is 1), inflation raises them:
| Inflation | Education total at ages 17-20 (if ₹18 lakh is today's price) | Marriage at 25 (if ₹50 lakh is today's price) | What the stated ₹50 lakh buys in today's rupees |
|---|---|---|---|
| 4% | ₹36.0 lakh | ₹128.2 lakh | ₹19.5 lakh |
| 5% | ₹42.7 lakh | ₹161.3 lakh | ₹15.5 lakh |
| 6% | ₹50.5 lakh | ₹202.4 lakh | ₹12.3 lakh |
| 8% | ₹70.4 lakh | ₹317.1 lakh | ₹7.9 lakh |
Indexing education and marriage to simulated Indian inflation raises the required starting lump by about 91% (mixed portfolio) to 65% (100% NIFTY) for a 90% success target (section 11).
8. Age-50 retirement corpus analysis
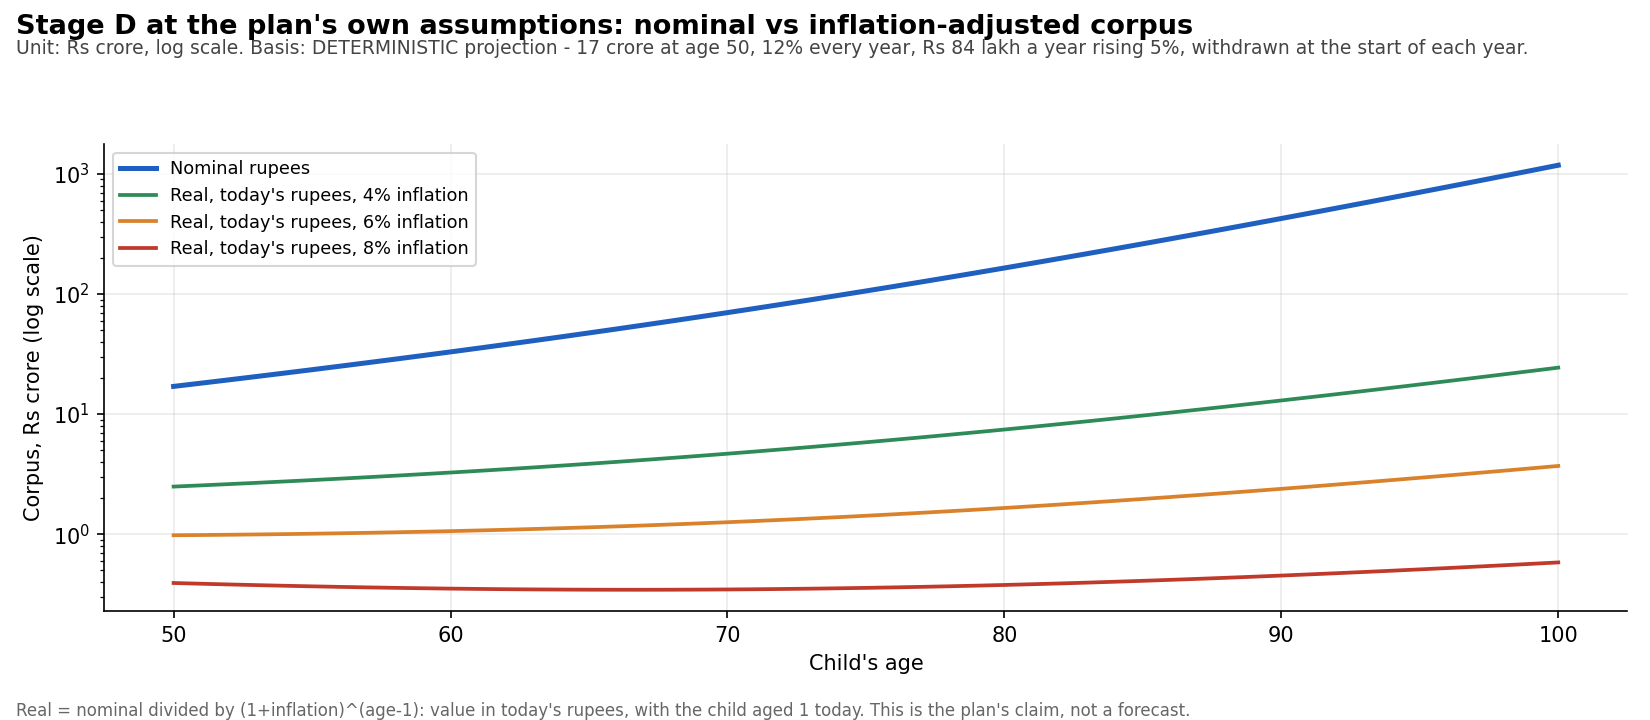
The plan needs ₹17 crore at age 50. That figure is worth ₹2.5 crore / ₹1.6 crore / ₹1.0 crore / ₹0.4 crore in today's rupees at 4% / 5% / 6% / 8% inflation over the 49 years from now. At a steady 12% the earlier stages deliver ₹9.3 crore (case A) to ₹17.2 crore (case B, end-of-year) at 50, so ₹17 crore is reached only in the most favourable reading. The question is what corpus at 50 would actually support the stated withdrawals.
Corpus needed at age 50 for ₹84 lakh a year (rising 5%) to last 50 years:
| Constant return | Highest first-year withdrawal rate that lasts to 100 | Corpus needed at 50 for ₹84 lakh |
|---|---|---|
| 6% | 2.5% | ₹33.6 crore |
| 8% | 3.7% | ₹22.8 crore |
| 10% | 5.0% | ₹16.7 crore |
| 12% | 6.5% | ₹12.9 crore |
In the simulations (actual Indian return and inflation sequences, block bootstrap) the corpus needed at 50 for ₹84 lakh +5% to last to 100 with 90% probability is ₹35.9 crore for 100% NIFTY and ₹21.5 crore for the 60/20/20 mix, versus ₹17 crore planned. So even if ₹17 crore is reached, the plan offers about a 70% chance (mixed) or 50% (100% NIFTY) of lasting to 100.
9. SWP sustainability through age 100
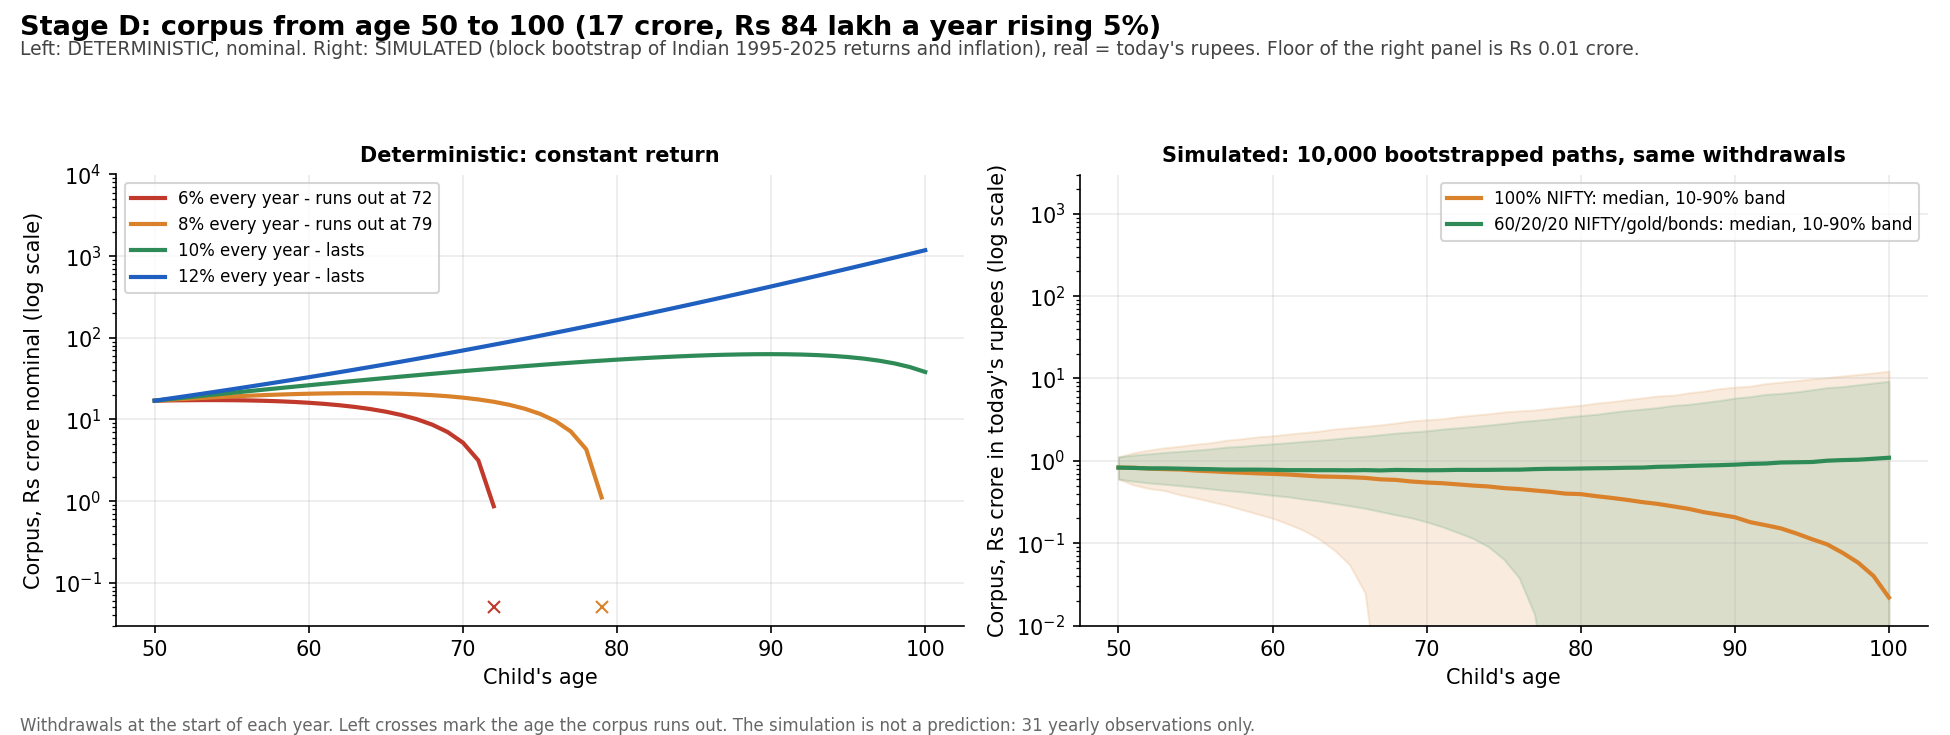
Deterministic, starting from the plan's ₹17 crore at age 50, ₹84 lakh +5% a year:
| Return | Runs out (start-of-year) | Corpus at 100 | Runs out (end-of-year) | Corpus at 100 | Runs out (monthly) | Corpus at 100 | Runs out (fixed ₹84 lakh) | Corpus at 100 | Largest first withdrawal that lasts |
|---|---|---|---|---|---|---|---|---|---|
| 6% | 72 | 0 | 73 | 0 | 73.0 | 0 | lasts | ₹54.6 crore | ₹42.5 lakh |
| 8% | 79 | 0 | 83 | 0 | 80.9 | 0 | lasts | ₹276.8 crore | ₹62.5 lakh |
| 10% | lasts | ₹38.2 crore | lasts | ₹216.1 crore | lasts | ₹121.1 crore | lasts | ₹920.2 crore | ₹85.6 lakh |
| 12% | lasts | ₹1,183.0 crore | lasts | ₹1,582.6 crore | lasts | ₹1,369.9 crore | lasts | ₹2,655.1 crore | ₹110.6 lakh |
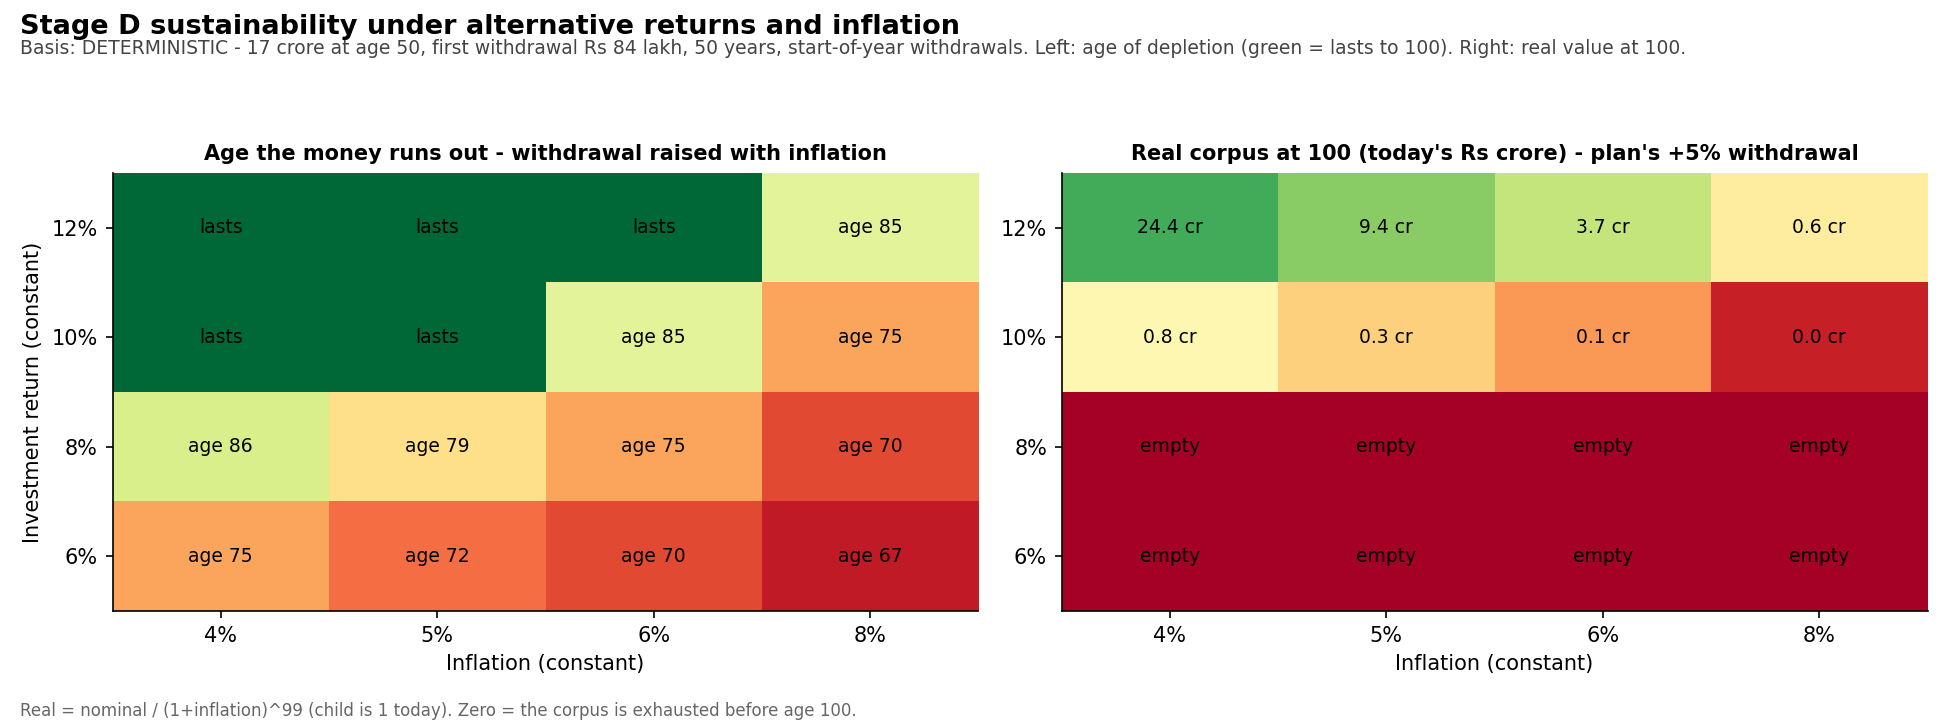
At a constant 12% the plan survives with a wide margin (largest sustainable first withdrawal ₹110.6 lakh against ₹84 lakh). At 10% the margin is thin (₹85.6 lakh against ₹84 lakh); at 8% the money runs out at age 79 and at 6% at age 72. The plan therefore depends on achieving about 10-12% every year for 50 years with no bad sequence, which history does not support.
Simulated sequence risk (Indian history, 10,000 paths). Survival depends on the order of returns, not just their average:
| Portfolio | Withdrawal | Depleted before 80 | Before 90 | Before 100 | Lasts to 100 |
|---|---|---|---|---|---|
| 100% NIFTY | ₹84 lakh +5% a year | 34% | 44% | 50% | 50% |
| 100% NIFTY | fixed ₹84 lakh | 7% | 8% | 9% | 91% |
| 100% NIFTY | ₹84 lakh indexed to inflation | 47% | 58% | 64% | 36% |
| 60/20/20 | ₹84 lakh +5% a year | 13% | 23% | 30% | 70% |
| 60/20/20 | fixed ₹84 lakh | 0% | 0% | 0% | 100% |
| 60/20/20 | ₹84 lakh indexed to inflation | 31% | 45% | 54% | 46% |
10. Historical rolling-window results
Every window uses actual yearly returns and actual CPI. Indian data supports 31 years, so no 50-year Indian retirement window exists; the Indian retirement test uses 25-year sub-windows, and a full 50-year test uses US data (a different market, USD, clearly labelled). Windows overlap heavily (consecutive start years share almost all their returns), so the number of independent observations is far smaller than the window count.
10.1 India, stage by stage (start year to end year in the 'Years' column; amounts in rupees)
| Scenario | Windows | Years | Depleted | Nominal CAGR median (min) | Cum. inflation median | Real CAGR median (min) | End corpus nominal median | End corpus real median |
|---|---|---|---|---|---|---|---|---|
| A 15L 5y / equity100 | 27 | 1995-2025 | 0 of 27 | 12.0% (-0.8%) | 1.33x | 5.9% (-9.7%) | 26.4 L | 20.0 L |
| A+B to age 25 case A / equity100 | 8 | 1995-2025 | 0 of 8 | 12.2% (9.7%) | 4.28x | 5.5% (2.7%) | 1.1 cr | 24.2 L |
| A+B to age 25 case B / equity100 | 8 | 1995-2025 | 0 of 8 | 12.2% (9.7%) | 4.28x | 5.5% (2.7%) | 1.4 cr | 32.9 L |
| B 15y SWP+education from the corpus at age 6 / equity100 | 17 | 1995-2025 | 0 of 17 | 12.2% (7.5%) | 2.70x | 5.0% (0.4%) | 0.7 cr | 24.7 L |
| C 25y from 1 crore / equity100 | 7 | 1995-2025 | 0 of 7 | 11.9% (9.8%) | 4.66x | 5.3% (2.9%) | 16.8 cr | 3.7 cr |
| D 25y of retirement (not 50y) / equity100 | 7 | 1995-2025 | 1 of 7 | 11.9% (9.8%) | 4.66x | 5.3% (2.9%) | 86.6 cr | 18.6 cr |
| A 15L 5y / balanced_60_20_20 | 27 | 1995-2025 | 0 of 27 | 11.6% (4.4%) | 1.33x | 5.2% (-2.3%) | 26.0 L | 19.3 L |
| A+B to age 25 case A / balanced_60_20_20 | 8 | 1995-2025 | 0 of 8 | 12.3% (10.5%) | 4.28x | 5.6% (3.5%) | 1.2 cr | 26.9 L |
| A+B to age 25 case B / balanced_60_20_20 | 8 | 1995-2025 | 0 of 8 | 12.3% (10.5%) | 4.28x | 5.6% (3.5%) | 1.5 cr | 35.8 L |
| B 15y SWP+education from the corpus at age 6 / balanced_60_20_20 | 17 | 1995-2025 | 0 of 17 | 13.0% (9.5%) | 2.70x | 5.8% (2.4%) | 0.8 cr | 29.3 L |
| C 25y from 1 crore / balanced_60_20_20 | 7 | 1995-2025 | 0 of 7 | 12.1% (10.7%) | 4.66x | 5.6% (3.8%) | 17.4 cr | 3.9 cr |
| D 25y of retirement (not 50y) / balanced_60_20_20 | 7 | 1995-2025 | 0 of 7 | 12.1% (10.7%) | 4.66x | 5.6% (3.8%) | 104.8 cr | 22.5 cr |
Stage A: ₹15 lakh, 5 years (age 1 to 6), no flows. A+B: ₹15 lakh to the start of age 25 with SWP (6-20) and education (case A = both from the corpus, B = SWP only). B: the 15 SWP years with education, from the age-6 corpus. C: ₹1 crore for 25 years untouched. D: ₹17 crore with ₹84 lakh +5% for 25 years (not 50). 'Depleted' = the corpus could not cover a year's withdrawal.
10.2 United States, 50-year retirement (USD, same withdrawal structure: 4.94% of the start, +5% a year, or raised by US CPI)
| Withdrawal | Returns | Windows | Years | Depleted | Median nominal CAGR | Median real CAGR | Best real ending value (start = 100) |
|---|---|---|---|---|---|---|---|
| +5% a year (plan) | S&P 500 price + 2.30% measured dividend gap | 16 | 1960-2024 | 15 of 16 | 9.1% | 4.8% | 1,112.3 |
| +5% a year (plan) | S&P 500 price only | 16 | 1960-2024 | 15 of 16 | 6.7% | 2.6% | 17.3 |
| inflation-indexed | S&P 500 price + 2.30% measured dividend gap | 16 | 1960-2024 | 15 of 16 | 9.1% | 4.8% | 865.0 |
| inflation-indexed | S&P 500 price only | 16 | 1960-2024 | 16 of 16 | 6.7% | 2.6% | 0.0 |
Fifty-year windows (start years 1960-1975) are few and overlapping, and the price-only S&P 500 omits dividends (a 2.30% a year gap, applied separately in the second variant). Even with the measured dividend gap, 15 of 16 windows ran out of money. This is US evidence about this withdrawal structure, not a statement about India.
11. Monte Carlo results
Method. Stationary block bootstrap of Indian calendar-year returns and CPI, 1995-2025 (31 joint observations of NIFTY price, gold, the bond proxy and inflation, drawn together so cross-correlation is kept), mean block length 3 years, 10,000 paths, seed 20261024, Python 3.13.2, numpy 2.4.6, pandas 3.0.3. Portfolios: 100% NIFTY price returns, and a 60/20/20 NIFTY/gold/bond mix rebalanced yearly. Independent-year draws (block length 1) are reported alongside as a test of the dependence assumption. Limits: 31 observations cannot estimate a 100-year process; bootstrapping repeats those years, so it cannot produce a worse run of years than the data contains in combination, and the future may differ from 1995-2025 (gold's rise, India's growth phase, falling then rising inflation).
11.1 Retirement stage alone: ₹17 crore at 50, ₹84 lakh rising 5% (the plan)
| Bootstrap | Portfolio | Depleted before 80 | before 90 | before 100 | Lasts to 100 | Nominal p5 (cr) | Nominal p50 (cr) | Nominal p95 (cr) | Real p5 (cr) | p10 | p25 | p50 | p75 | p90 | Real p95 (cr) | Min real balance p5 (cr) | Worst drawdown p5 | Worst drawdown |
|---|---|---|---|---|---|---|---|---|---|---|---|---|---|---|---|---|---|---|
| block(3y) | 100% NIFTY | 34% | 44% | 50% | 50% | 0.00 | 10.81 | 9,245.00 | 0.00 | 0.00 | 0.00 | 0.02 | 3.05 | 12.30 | 24.31 | 0.00 | -100% | -100% |
| block(3y) | 60/20/20 | 13% | 23% | 30% | 70% | 0.00 | 507.89 | 5,919.82 | 0.00 | 0.00 | 0.00 | 1.09 | 3.96 | 9.27 | 14.85 | 0.00 | -100% | -100% |
| iid years | 100% NIFTY | 40% | 47% | 52% | 48% | 0.00 | 0.00 | 24,768.00 | 0.00 | 0.00 | 0.00 | 0.00 | 4.87 | 25.28 | 57.75 | 0.00 | -100% | -100% |
| iid years | 60/20/20 | 22% | 31% | 36% | 64% | 0.00 | 480.00 | 9,646.39 | 0.00 | 0.00 | 0.00 | 1.02 | 5.07 | 13.36 | 23.20 | 0.00 | -100% | -100% |
Ending corpus values are at age 100; 'real' is in today's rupees (the child is 1 now; deflated by the simulated CPI path). A zero percentile means that many paths ran out of money before 100. The 'worst drawdown' is the largest peak-to-trough fall of the corpus in a path; −100% means the corpus was exhausted. The minimum real balance during retirement at the 5th percentile is the lowest point such paths reach (0 where the money ran out).
11.2 Withdrawal rate the Indian history supports
| Portfolio | Target chance of lasting to 100 | Withdrawal rule | Max first-year rate | Annual on ₹17 cr | Monthly on ₹17 cr | Corpus needed for ₹84 lakh |
|---|---|---|---|---|---|---|
| 100% NIFTY | 90% | raised with simulated inflation | 1.62% | ₹27.5 lakh | ₹2.29 lakh | ₹51.9 crore |
| 100% NIFTY | 90% | raised 5% a year | 2.34% | ₹39.8 lakh | ₹3.31 lakh | ₹35.9 crore |
| 100% NIFTY | 95% | raised with simulated inflation | 1.19% | ₹20.3 lakh | ₹1.69 lakh | ₹70.5 crore |
| 100% NIFTY | 95% | raised 5% a year | 1.80% | ₹30.5 lakh | ₹2.55 lakh | ₹46.8 crore |
| 60/20/20 | 90% | raised with simulated inflation | 2.92% | ₹49.7 lakh | ₹4.14 lakh | ₹28.7 crore |
| 60/20/20 | 90% | raised 5% a year | 3.91% | ₹66.4 lakh | ₹5.53 lakh | ₹21.5 crore |
| 60/20/20 | 95% | raised with simulated inflation | 2.49% | ₹42.4 lakh | ₹3.53 lakh | ₹33.7 crore |
| 60/20/20 | 95% | raised 5% a year | 3.47% | ₹58.9 lakh | ₹4.91 lakh | ₹24.2 crore |
11.3 Whole life, all costs as stated, starting from ₹15 lakh at age 1
| Portfolio | Education | Education + marriage indexed to CPI | Reaches 100 | Depleted by 20 | by 25 | before 50 | before 80 | before 90 |
|---|---|---|---|---|---|---|---|---|
| 100% NIFTY | case A | no | 20.3% | 24% | 49% | 49% | 77% | 79% |
| 100% NIFTY | case A | yes | 6.5% | 54% | 87% | 87% | 93% | 93% |
| 100% NIFTY | case B | no | 25.9% | 8% | 33% | 33% | 71% | 73% |
| 100% NIFTY | case B | yes | 10.9% | 8% | 77% | 77% | 88% | 89% |
| 60/20/20 | case A | no | 26.0% | 7% | 34% | 34% | 71% | 73% |
| 60/20/20 | case A | yes | 3.5% | 45% | 92% | 92% | 96% | 96% |
| 60/20/20 | case B | no | 37.3% | 0% | 14% | 14% | 58% | 61% |
| 60/20/20 | case B | yes | 8.9% | 0% | 79% | 79% | 90% | 91% |
As stated, the whole plan reaches age 100 in 20.3% (case A) to 25.9% (case B) of 100% NIFTY paths and 26.0% to 37.3% of 60/20/20 paths. It usually fails early, while a small corpus is being drawn down: in case A 24% of 100% NIFTY paths and 7% of mixed paths are depleted by age 20 (end of the SWP) and 49% and 34% by the marriage at 25.
11.4 What starting lump, or yearly contribution, would work (whole life, all costs as stated)
| Portfolio | Education | Education + marriage indexed to CPI | Target chance of reaching 100 | Required lump at age 1 |
|---|---|---|---|---|
| 100% NIFTY | case A | no | 50% | ₹30 lakh |
| 100% NIFTY | case A | no | 80% | ₹67 lakh |
| 100% NIFTY | case A | no | 90% | ₹109 lakh |
| 100% NIFTY | case A | no | 95% | ₹167 lakh |
| 100% NIFTY | case A | yes | 50% | ₹54 lakh |
| 100% NIFTY | case A | yes | 80% | ₹116 lakh |
| 100% NIFTY | case A | yes | 90% | ₹180 lakh |
| 100% NIFTY | case A | yes | 95% | ₹261 lakh |
| 100% NIFTY | case B | no | 50% | ₹26 lakh |
| 100% NIFTY | case B | no | 80% | ₹61 lakh |
| 100% NIFTY | case B | no | 90% | ₹100 lakh |
| 100% NIFTY | case B | no | 95% | ₹157 lakh |
| 100% NIFTY | case B | yes | 50% | ₹43 lakh |
| 100% NIFTY | case B | yes | 80% | ₹98 lakh |
| 100% NIFTY | case B | yes | 90% | ₹155 lakh |
| 100% NIFTY | case B | yes | 95% | ₹227 lakh |
| 60/20/20 | case A | no | 50% | ₹21 lakh |
| 60/20/20 | case A | no | 80% | ₹32 lakh |
| 60/20/20 | case A | no | 90% | ₹40 lakh |
| 60/20/20 | case A | no | 95% | ₹49 lakh |
| 60/20/20 | case A | yes | 50% | ₹39 lakh |
| 60/20/20 | case A | yes | 80% | ₹61 lakh |
| 60/20/20 | case A | yes | 90% | ₹77 lakh |
| 60/20/20 | case A | yes | 95% | ₹94 lakh |
| 60/20/20 | case B | no | 50% | ₹18 lakh |
| 60/20/20 | case B | no | 80% | ₹28 lakh |
| 60/20/20 | case B | no | 90% | ₹36 lakh |
| 60/20/20 | case B | no | 95% | ₹44 lakh |
| 60/20/20 | case B | yes | 50% | ₹31 lakh |
| 60/20/20 | case B | yes | 80% | ₹49 lakh |
| 60/20/20 | case B | yes | 90% | ₹63 lakh |
| 60/20/20 | case B | yes | 95% | ₹77 lakh |
Alternatively, level yearly contributions at the start of each year from age 1 to 24 (24 payments) on top of the ₹15 lakh:
| Portfolio | Education | Target | Per year | Per month | Total paid in |
|---|---|---|---|---|---|
| 100% NIFTY | case A | 80% | ₹4.1 lakh | ₹0.34 lakh | ₹98 lakh |
| 100% NIFTY | case A | 90% | ₹7.0 lakh | ₹0.58 lakh | ₹167 lakh |
| 100% NIFTY | case B | 80% | ₹3.6 lakh | ₹0.30 lakh | ₹87 lakh |
| 100% NIFTY | case B | 90% | ₹6.5 lakh | ₹0.54 lakh | ₹156 lakh |
| 60/20/20 | case A | 80% | ₹1.6 lakh | ₹0.13 lakh | ₹38 lakh |
| 60/20/20 | case A | 90% | ₹2.3 lakh | ₹0.19 lakh | ₹54 lakh |
| 60/20/20 | case B | 80% | ₹1.2 lakh | ₹0.10 lakh | ₹30 lakh |
| 60/20/20 | case B | 90% | ₹1.9 lakh | ₹0.16 lakh | ₹45 lakh |
For the recommended 100% NIFTY lump (₹109 lakh) the real corpus at age 100 has percentiles (₹ crore, today's rupees): p5 0.0, p10 0.0, p25 5.8, p50 32.1, p75 137.4, p90 493.6, p95 1,072.9. Note the very wide spread: the median is large, but the left tail is zero by construction (10% of paths fail).
12. Sensitivity analysis
12.1 Returns x inflation (deterministic, Stage D from ₹17 crore)
Plan: ₹84 lakh rising 5% a year - age the money runs out ('lasts' = survives to 100) and real corpus at 100 (today's ₹ crore):
| Return \ Inflation | 4% | 5% | 6% | 8% |
|---|---|---|---|---|
| 6% | runs out at 72 | runs out at 72 | runs out at 72 | runs out at 72 |
| 8% | runs out at 79 | runs out at 79 | runs out at 79 | runs out at 79 |
| 10% | lasts (0.8 cr real) | lasts (0.3 cr real) | lasts (0.1 cr real) | lasts (0.0 cr real) |
| 12% | lasts (24.4 cr real) | lasts (9.4 cr real) | lasts (3.7 cr real) | lasts (0.6 cr real) |
₹84 lakh raised each year by the assumed inflation - age the money runs out ('lasts' = survives to 100) and real corpus at 100 (today's ₹ crore):
| Return \ Inflation | 4% | 5% | 6% | 8% |
|---|---|---|---|---|
| 6% | runs out at 75 | runs out at 72 | runs out at 70 | runs out at 67 |
| 8% | runs out at 86 | runs out at 79 | runs out at 75 | runs out at 70 |
| 10% | lasts (6.1 cr real) | lasts (0.3 cr real) | runs out at 85 | runs out at 75 |
| 12% | lasts (32.9 cr real) | lasts (9.4 cr real) | lasts (2.1 cr real) | runs out at 85 |
₹84 lakh fixed for 50 years - age the money runs out ('lasts' = survives to 100) and real corpus at 100 (today's ₹ crore):
| Return \ Inflation | 4% | 5% | 6% | 8% |
|---|---|---|---|---|
| 6% | lasts (1.1 cr real) | lasts (0.4 cr real) | lasts (0.2 cr real) | lasts (0.0 cr real) |
| 8% | lasts (5.7 cr real) | lasts (2.2 cr real) | lasts (0.9 cr real) | lasts (0.1 cr real) |
| 10% | lasts (18.9 cr real) | lasts (7.3 cr real) | lasts (2.9 cr real) | lasts (0.5 cr real) |
| 12% | lasts (54.7 cr real) | lasts (21.2 cr real) | lasts (8.3 cr real) | lasts (1.3 cr real) |
12.2 Withdrawal strategies compared (Monte Carlo, ₹17 crore at 50, Indian history, block bootstrap)
These are different rules and must not be compared as if they were the same thing: 'fixed amount, raised 5%' and 'raised with inflation' fix the rupee path; 'percentage of the current corpus' fixes the rate and lets income follow the market; the 'guardrail' rule starts at 4.94%, raises with inflation, cuts spending 10% if the rate climbs above 1.2x the start rate and raises it 10% if it falls below 0.8x.
| Portfolio | Strategy | Lasts to 100 | Median real corpus at 100 (cr) | 10th pct (cr) | Real income in the worst year, 5th pct (₹ lakh, today's) |
|---|---|---|---|---|---|
| 100% NIFTY | ₹84 lakh +5% a year | 50% | 0.02 | 0.00 | - |
| 100% NIFTY | fixed ₹84 lakh | 91% | 2.26 | 0.02 | - |
| 100% NIFTY | ₹84 lakh indexed to inflation | 36% | 0.00 | 0.00 | - |
| 100% NIFTY | 3% of current corpus | 100% | 1.20 | 0.20 | 0.2 L |
| 100% NIFTY | 4% of current corpus | 100% | 0.72 | 0.12 | 0.2 L |
| 100% NIFTY | 5% of current corpus | 100% | 0.42 | 0.07 | 0.2 L |
| 100% NIFTY | guardrail from 4.94% | 89% | 0.35 | 0.00 | 0.0 L |
| 60/20/20 | ₹84 lakh +5% a year | 70% | 1.09 | 0.00 | - |
| 60/20/20 | fixed ₹84 lakh | 100% | 4.05 | 0.98 | - |
| 60/20/20 | ₹84 lakh indexed to inflation | 46% | 0.00 | 0.00 | - |
| 60/20/20 | 3% of current corpus | 100% | 1.80 | 0.58 | 0.8 L |
| 60/20/20 | 4% of current corpus | 100% | 1.07 | 0.34 | 0.7 L |
| 60/20/20 | 5% of current corpus | 100% | 0.63 | 0.20 | 0.6 L |
| 60/20/20 | guardrail from 4.94% | 100% | 0.65 | 0.17 | 0.6 L |
Percentage rules never run out but the income can fall a lot (for 100% NIFTY the 5th-percentile worst year pays well under ₹1 lakh in today's rupees). A fixed rupee amount that is not raised survives most often but loses purchasing power every year; the plan's +5% is a mild version of that.
12.3 Required starting lump by assumed constant return (whole life, all costs as stated, deterministic)
| Constant return every year | Case A (education from the corpus) | Case B (education separate) |
|---|---|---|
| 6% | ₹222.7 lakh | ₹216.2 lakh |
| 8% | ₹73.6 lakh | ₹68.9 lakh |
| 10% | ₹30.9 lakh | ₹27.6 lakh |
| 12% | ₹16.4 lakh | ₹13.9 lakh |
Compare ₹15 lakh in the original. The need falls steeply as the assumed return rises, which shows how much the plan leans on 12%.
13. Inflation-adjusted purchasing-power analysis
| Inflation | ₹50 lakh marriage at 25 buys (today's ₹) | ₹84 lakh at 50 buys (today's ₹) | ₹17 crore at 50 buys | The plan's last withdrawal (age 99) buys |
|---|---|---|---|---|
| 4% | ₹19.5 lakh | ₹12.3 lakh (₹102,439 a month) | ₹2.5 crore | ₹19.6 lakh |
| 5% | ₹15.5 lakh | ₹7.7 lakh (₹64,095 a month) | ₹1.6 crore | ₹7.7 lakh |
| 6% | ₹12.3 lakh | ₹4.8 lakh (₹40,282 a month) | ₹1.0 crore | ₹3.0 lakh |
| 8% | ₹7.9 lakh | ₹1.9 lakh (₹16,119 a month) | ₹0.4 crore | ₹0.5 lakh |
If the family wants ₹7 lakh a month in today's purchasing power from age 50, the first-year withdrawal would have to be ₹1,460 lakh at 6% inflation (₹574 lakh at 4%, ₹3,648 lakh at 8%), many times the plan's ₹84 lakh. The plan's ₹7 lakh a month is a nominal amount; its real value is small and shrinks every year, because 5% escalation is below historical inflation. '₹1,325 crore at age 100' is likewise a nominal number: at 6% inflation it is worth about ₹4.1 crore in today's rupees, and only if the 12% return holds for 99 years.
14. Major financial risks
- Return risk and the 12% assumption. NIFTY price returns compounded at 10.5% (1995-2025); the S&P 500 at 8.1% price (1951-2025). A 12% constant return for 89 years has no historical support.
- Sequence-of-returns risk. Withdrawals in the first decade of retirement hurt most; the same average return can end with ₹0 or hundreds of crores (section 11).
- Inflation risk. Indian CPI compounded 7.1% a year over 1960-2025 and more than 5% over most 10-20-year windows; the plan's 5% escalation is below that, so real income shrinks.
- Concentration and regime risk. 31 years of Indian data, one growth era; gold's recent run inflates the mixed portfolio's result.
- Longevity and horizon. A 50-year drawdown is outside what the Indian data (31 years) or the US data (few independent 50-year periods) can test.
- Tax and costs (not modelled). Capital-gains tax, expense ratios and exit loads reduce every return; a 1-2% annual drag would materially lower survival.
- Behaviour. A 50-year plan needs the same discipline through a -52% year (2008); ad-hoc changes dominate outcomes.
- Model risk. Education and marriage costs are uncertain and probably rise faster than CPI; medical costs, family changes and policy changes are not included.
- Data risk. Price-only NIFTY, a spliced bond proxy, a harmonised annual CPI with a 2014 methodology break, and a 2019 disagreement with CPI-IW.
15. Recommended modifications to the original plan
None of these is an optimisation to hit a target corpus; each is chosen to raise the chance the money lasts and to keep real purchasing power.
-
Fix the starting capital or add contributions. At a steady 12% ₹15 lakh is almost enough (₹16.4 lakh needed in case A), but at 10% it takes ₹30.9 lakh, at 8% ₹73.6 lakh and at 6% ₹222.7 lakh. For a 90% chance of reaching 100 on Indian history with every cost paid, plan for about ₹40.5 lakh (60/20/20) to ₹108.9 lakh (100% NIFTY) at age 1, or about ₹2.3 lakh to ₹7.0 lakh a year for 24 years on top of ₹15 lakh. If education and marriage amounts are in today's prices, add roughly 91% (mixed) to 65% (100% NIFTY) (section 11.4).
-
Fund education separately and early. Keep the ₹18 lakh (more in real terms) in a low-volatility reserve for ages 17-20 so a market fall in the education years does not force sales, and so the retirement corpus is not drawn down early. Case B (education separate) improves the whole-life success from 20% to 26% (100% NIFTY) and from 26% to 37% (mixed).
-
Do not let the corpus fall below the marriage need. The marriage (₹50 lakh at 25) is the most fragile point after the SWP years; hold the amount due within the next 3-5 years in low-volatility assets as it approaches (a glide path), rather than staying 100% in equity.
-
Do not rely on 12%. Plan with 8-10% nominal for equity-heavy portfolios and test at 6%. At 8% the plan's retirement stage fails at age 79.
-
Diversify, with caution. For the plan's own withdrawals a 60/20/20 NIFTY/gold/bond mix cut the chance of running out before 100 from 50% to 30%, but this uses gold's exceptional 1995-2025 record and a spliced bond proxy; do not treat the mixed numbers as guaranteed.
-
Withdraw by a rule that reacts to the market. At ₹17 crore, a start rate of about 3.9% (mixed) or 2.3% (100% NIFTY) is what history supports for 90% success with ₹84 lakh-style escalation; the plan's 4.94% is too high for that standard. A guardrail rule (start near 4-5%, raise with inflation, cut 10% when the rate drifts 20% above the start) lasted to 100 in 100% of mixed-portfolio paths, at the price of lower income in bad runs (100% NIFTY: 89%).
-
Define the retirement budget in today's rupees. State the spending goal in real terms (for example ₹X lakh a month in today's money) and let the model convert it; ₹7 lakh a month nominal at 50 is a modest real amount.
-
Review every 3-5 years. Re-run this analysis with actual balances; adjust contributions and withdrawals rather than assuming a path.
-
Model taxes and costs before committing to any number here.
16. Conclusion: is it feasible?
| Scenario | Verdict | Evidence |
|---|---|---|
| Early stages to age 25 at a steady 12% (case B, end-of-year) | Feasible | ₹151.4 lakh at 25 vs the claimed ₹1.50 crore |
| Early stages to age 25 at a steady 12% (case A, education from the corpus) | Conditionally feasible | ₹105.0 lakh-₹118.1 lakh at 25 (70%-79% of the claim); marriage payable, but the age-50 corpus is only ₹9.3 crore-₹11.6 crore |
| Whole plan, steady 12% (optimistic) | Case A: not feasible; case B: feasible | Case A runs out at age 68; case B lasts to 100 |
| Whole plan, steady 10% (moderate) | Not feasible from ₹15 lakh | Needs ₹30.9 lakh (case A) / ₹27.6 lakh (case B) at age 1 |
| Whole plan, steady 8% / 6% (conservative) | Not feasible | Needs ₹73.6 lakh / ₹222.7 lakh (case A) at age 1 |
| Whole plan as written, Indian historical sequences (simulated) | Not reliable | Reaches 100 in 20%-26% of paths (100% NIFTY); 26%-37% (60/20/20) |
| Stage D from ₹17 crore, constant 12% (optimistic) | Feasible | Lasts; largest sustainable first withdrawal ₹110.6 lakh vs ₹84 lakh |
| Stage D from ₹17 crore, constant 10% (moderate) | Conditionally feasible | Lasts with a thin margin (₹85.6 lakh vs ₹84 lakh); runs out at 85 if inflation is 6% and withdrawals follow it |
| Stage D from ₹17 crore, constant 8% / 6% (conservative) | Not feasible | Runs out at age 79 (8%) and 72 (6%) |
| Stage D from ₹17 crore, Indian history, 100% NIFTY (simulated) | Not feasible at the plan's withdrawal | 50% chance of lasting to 100 |
| Stage D from ₹17 crore, Indian history, 60/20/20 (simulated) | Conditionally feasible | 70% chance; about 3.9% start rate gives 90% |
| Stage D, US history, 50 years, same structure | Not feasible | 15 of 16 historical windows ran out (price returns); 15 of 16 with the measured dividend gap added |
| Revised plan: lump or contributions of section 11.4, flexible withdrawals | Conditionally feasible | About 90% chance of reaching 100 with every cost paid, if the 1995-2025 record is a fair guide |
Evidence-based verdict. Once the ages are corrected, the plan's early stages are not far from what the arithmetic gives at a steady 12%: about ₹1.05-1.5 crore at 25, enough for the marriage. It is the dependence on 12% every year for 99 years that makes the plan fragile: at the 10.5% NIFTY has actually compounded (price only) or with an ordinary run of bad years, the plan runs out, most often at the marriage or in the first two decades of retirement. What would materially improve its chance: a starting investment of roughly ₹40.5 lakh to ₹108.9 lakh (or about ₹2.3 lakh to ₹7.0 lakh a year for 24 years), a diversified portfolio with a glide path into the marriage and retirement, education funded from a separate reserve, and a withdrawal policy of about 3-4% of a corpus that adjusts to market conditions (or a start rate near 3.9%-2.3% with escalation). The target should be the probability of the money lasting and the real purchasing power of the income, not the size of the final corpus.
Assumptions and limitations
- Scope. Annual model; fixed contribution and withdrawal dates; no taxes, fees, loads, insurance, or transaction costs; amounts as stated in the brief (nominal unless said otherwise).
- Data. NIFTY is a price index; no NIFTY total-return history; bond proxy is spliced; gold includes an assumed 3% GST factor (constant) and a global-price estimate for 2005 and earlier; 31 yearly Indian observations; US history is separate and in USD; no Shiller, Treasury or CPI-level data in the project; 2026 excluded as incomplete.
- CPI. World Bank annual averages; 2014 methodology break; no RBI/MoSPI cross-check was possible here; the CPI-IW comparison shows a large 2019 gap; no missing years were interpolated.
- Simulation. Bootstrap reuses history; it cannot create unseen regimes; block length 3 is a choice (independent years shown for comparison); results are conditional on 1995-2025; probabilities are model outputs, not forecasts.
- Deterministic runs assume a constant return and inflation, which understate risk; they are used only to validate the original arithmetic and to show sensitivities.
- Approximations. Education and marriage amounts are used as stated unless a table says 'indexed'; the US dividend gap is a measured average (1989-2025), applied as a constant; the 'real' value of the retirement corpus is deflated from today (age 1).
Reproducing this report
From backend/ (venv active):
python -m childplan.cpi_fetch      # World Bank CPI -> reports/child_financial_plan/data
python -m childplan.run_all        # validation, rolling windows, Monte Carlo, sensitivity -> results/
python -m childplan.extras         # CPI cross-checks, inflated costs, required contributions
python -m childplan.charts         # PNG charts -> charts/
python -m childplan.report         # this Markdown file
pytest tests/test_childplan.py -q  # unit tests
Code: backend/childplan/ (engine.py cash-flow arithmetic, plan.py the plan, data.py loaders and data inventory, simulate.py windows/Monte Carlo/sensitivity, charts.py, report.py). Machine-readable results: results/*.csv, results/results.json, results/extras.json. See README.md.
Sources
- World Bank, World Development Indicators, Inflation, consumer prices (annual %), FP.CPI.TOTL.ZG: https://data.worldbank.org/indicator/FP.CPI.TOTL.ZG (API: https://api.worldbank.org/v2/country/IND/indicator/FP.CPI.TOTL.ZG).
- Project datasets: NIFTY 50 closes (
eq_store, NSE), S&P 500 and S&P 500 Total Return (scr_global_price, GlobalArchive/Yahoo Finance), MCX gold and GOLDINR, SBI FD rates, NIFTY Composite G-sec Index (te_price/eq_store), CPI-IW (te_price). - Idea source: a Tamil-language video by Mahesh, Financial Practitioner (https://www.youtube.com/watch?v=rUecOfU6U3Y), whose title promises ₹1,000 crore for a child. Only its title could be read in this environment (no transcript), so every assumption analysed here is the one in the brief; none was taken from the video.